Third-Party Explorer
Third-Party Explorer
The data collected in User Journeys, Web Vitals, Google Lighthouse and Page Load monitors gathers lots of information on your third parties.
RapidSpike’s Third Party Explorer brings this data together.
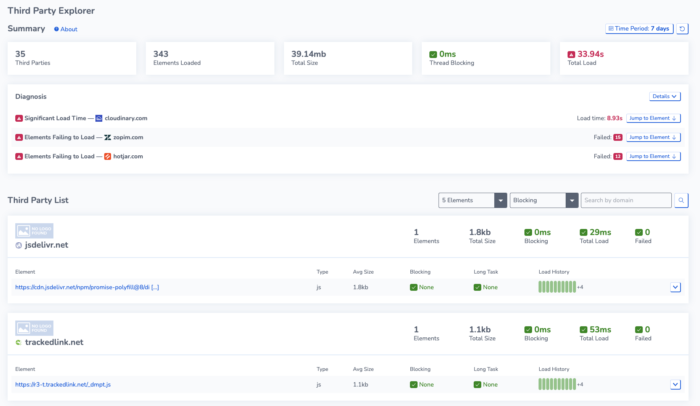
Site owners can use the diagnosis section to see any key highlights, such as any Third Parties with significant load time, thread blocking or frequent element failures like 404s. This section is designed to quickly identify issues.
The Third Party list contains all the third parties that have been identified in any of your monitors. You can see a full load history which allows you to pinpoint performance spikes and identify intermittent problems. RapidSpike also offers options to order the list by the following options.
- Blocking
- Elements Loaded
- Total Size
- Total Load
- Load Failed

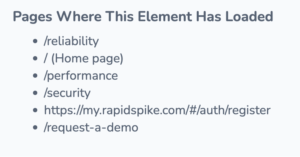
To access the full load history for each element, you should press the dropdown icon. This will show a list of test results where RapidSpike has seen this element. At the bottom of the list, there is also a list of the pages where the third party appeared.


One thing to remember about the Third Party Explorer is that the more you monitor, the more insights you will be able to see. Therefore, you should utilise the full suite of RapidSpike monitors mentioned in this course to create a full picture of your website and third parties.