User Journeys and Page Load Monitors
User Journeys and Page Load Monitors
User Journeys and Page Load Monitors work by loading your page within a real browser. You can create page load monitors for each of the critical pages on your website and monitor the third parties in use.
Additionally, user journeys interact with your website and can access multiple pages within a user transaction. For example, a typical user journey for an e-commerce website would navigate from the home page to a product and then through to the checkout and payment pages. This allows you to gain insight into the third parties on each of these pages within one transaction.
Waterfall
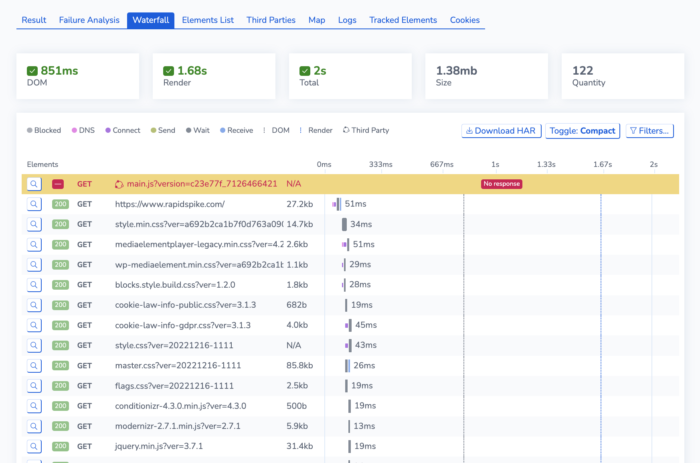
Within your test results, for page load monitors and user journeys, you can view data about your third parties. Go to the Waterfall tab to see the network request waterfall for the current page. This records all network requests the browser has had to make to download resources for the webpage. Third parties can be identified with the circular logo by the URL. Use the waterfall to identify any problematic third parties; these could be third parties with no response or incorrect HTTP status codes. You can also identify if there are a lot of third parties with long load times or that are blocking other parts of the page from loading. The waterfall can help visually identify third parties having an impact on page performance.

You can click the magnifying glass icon to explore this element which brings up historical data across multiple tests.
Third Parties Tab
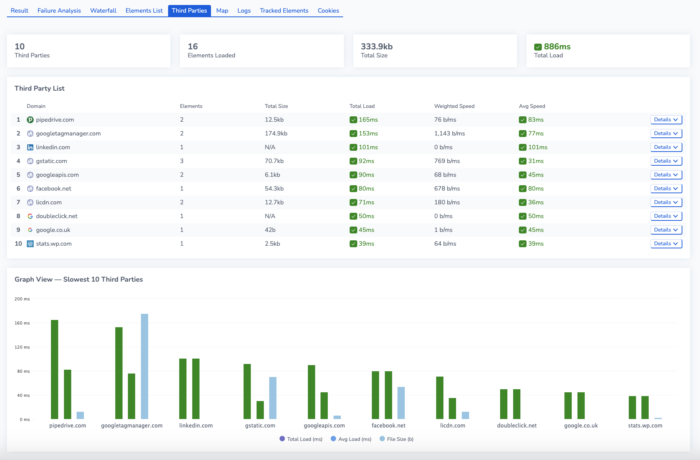
The Third Parties tab allows you to view the full list of Third Parties on the current page. This tab allows you to see the amount of Third Parties that appeared in the current test and contains information about the size and load times of each. You can see more information about each of the elements linked to the third party by clicking on details.

Read More