Uptime Test Results
Uptime Test Results
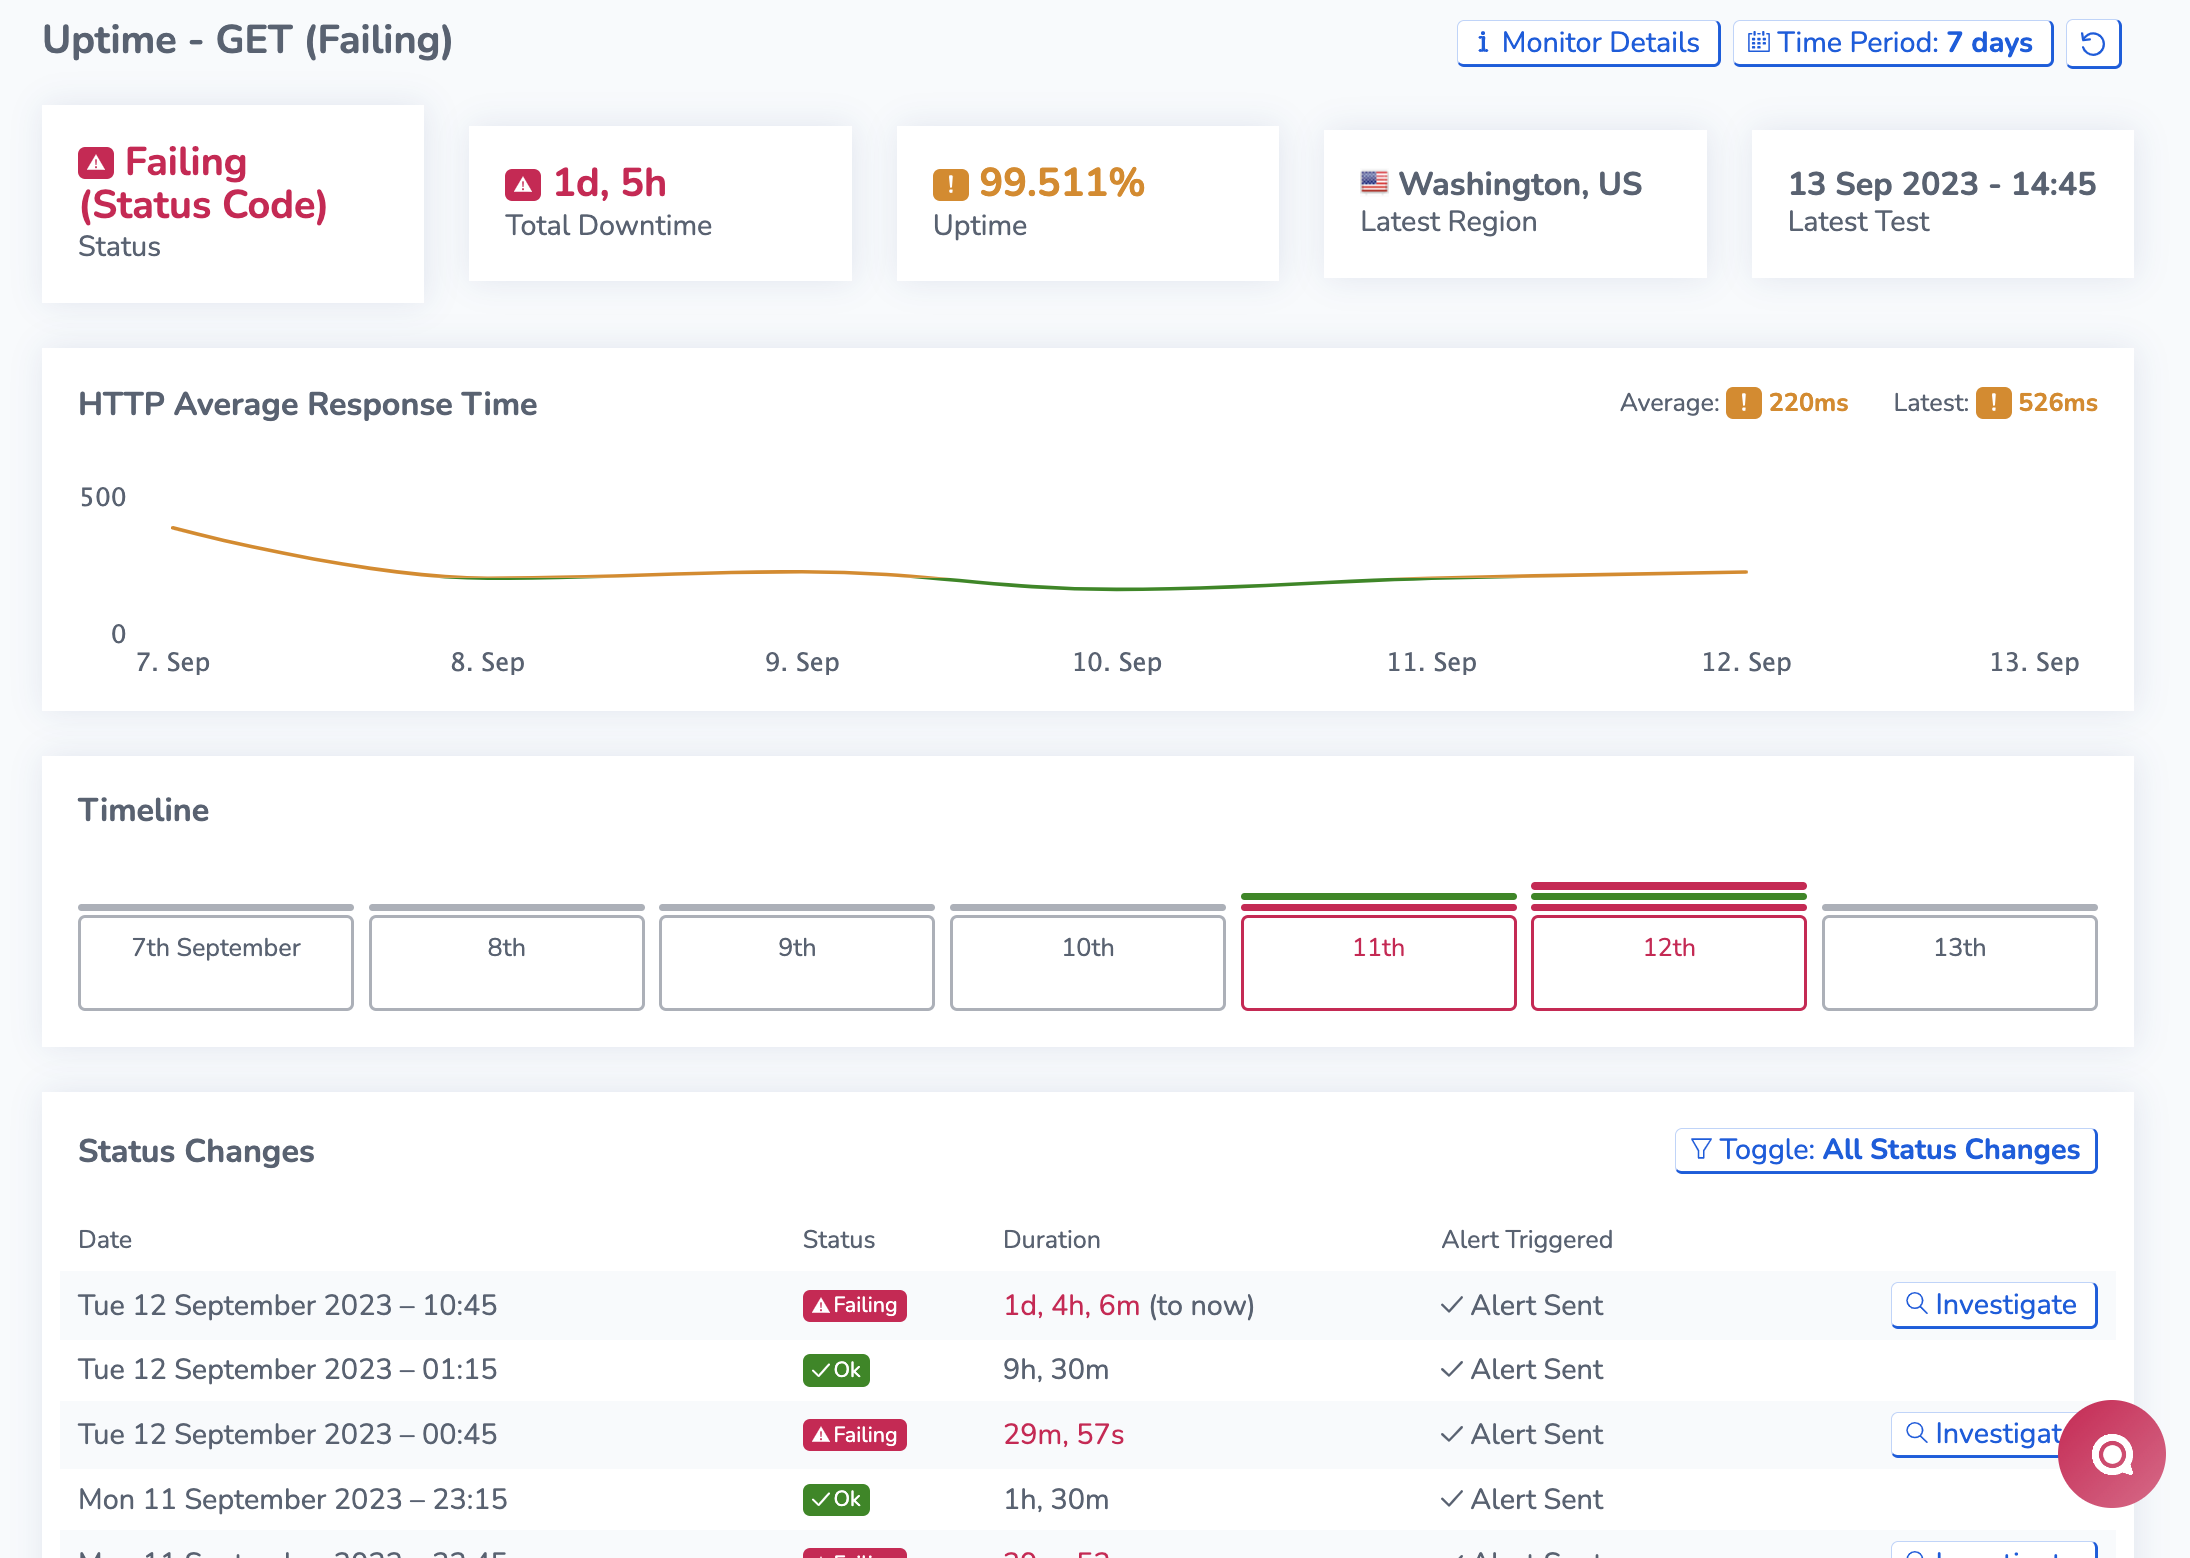
You can get to the latest test results for your uptime monitor by going to Websites > Pages or Servers > Uptime and selecting the page you want to check. Alternatively, you can select Uptime from Dashboards. This will bring you to a test results page where you can see a bunch of data about your uptime.

The latest test result for an Uptime Monitor
At the top of the page are statistics and information about your page uptime. This includes:
- The current status: is the monitor receiving the correct response? (For websites, this asks if the HTTP response code is correct). If the status of your website/server is “Failing,” this suggests it is currently down or experiencing issues. There are several common reasons for a failing status, including your site/server being down, a website returning a different status code than expected, or our monitoring system being blocked by bot detection.
- Total Downtime over the last 30 days
- Uptime Percentage (the higher the better)
- Latest Region tested
- Latest Test time
Response time refers to the time it takes for your website or service to respond to a user’s request, typically measured in milliseconds. A lower response time indicates faster performance. Slow response times can impact your website’s conversion rates and revenue.
The Timeline highlights any changes in the website status over the last few days. You can see more details underneath in the status changes section.
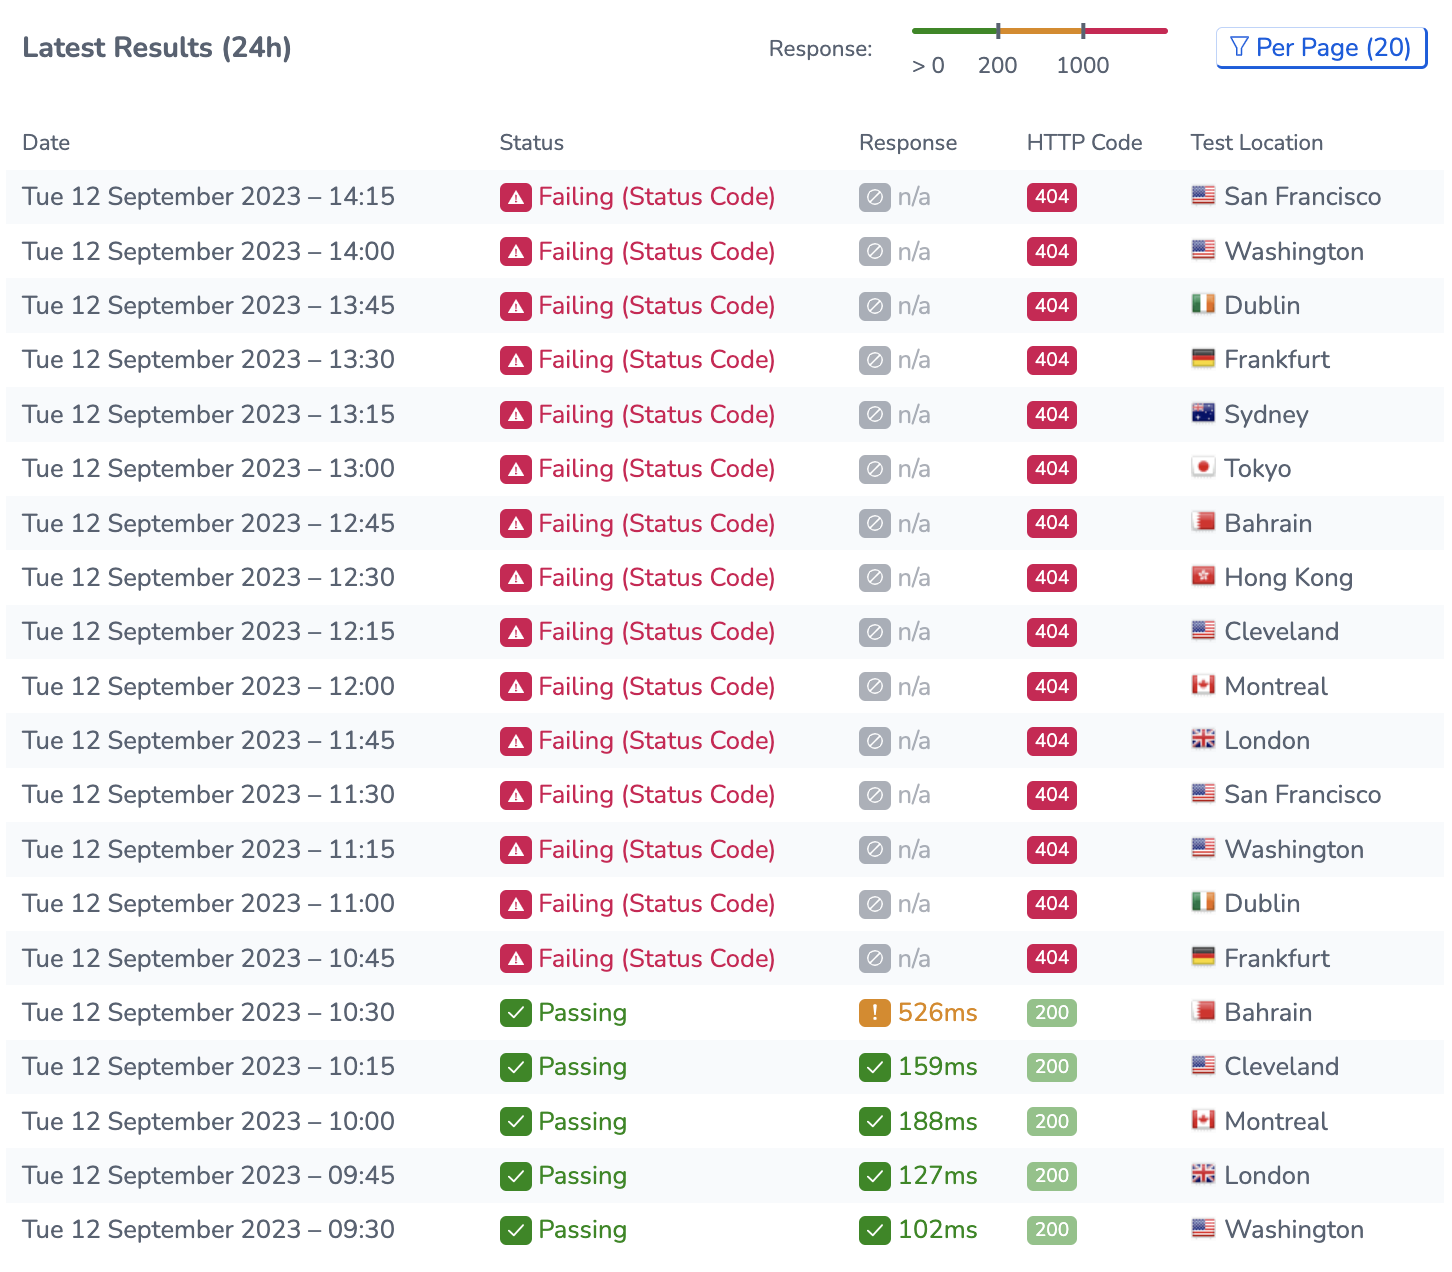
Further down, view the Latest Results for the monitor.

The Latest results section for a website HTTP Monitor. You can see the change in HTTP responses.