Performance
Performance
The Performance score evaluates key metrics for how quickly your page loads. This contains several metrics:
First Contentful Paint (FCP): FCP is when the browser starts rendering the first visible content on a webpage. It’s a critical metric because it indicates to users that something is happening and the page is loading. Faster FCP times lead to a better user experience.
Time to Interactive (TTI): TTI measures when a webpage becomes fully interactive and responsive to user input. It signifies the point at which users can actively engage with the page, such as clicking buttons and interacting with forms. A quicker TTI enhances user engagement.
Speed Index: The Speed Index provides a score representing the load time based on how quickly visible content appears. It takes into account the visual completeness of the page (content loaded within the viewport), not just when the first element is painted. A faster Speed Index time implies faster-perceived loading times.
Total Blocking Time (TBT): TBT measures the total time when the main thread of a webpage is blocked and unresponsive to user input. It reflects the period during which users may experience delays or unresponsiveness. A lower TBT means a smoother and more responsive user experience.
Largest Contentful Paint (LCP): LCP measures how long it takes for the largest content element, such as a large image or video, to be rendered and displayed within the user’s viewport. It’s a critical aspect of loading performance, and improving LCP can significantly enhance user satisfaction.
Cumulative Layout Shift (CLS): CLS assesses the visual stability of a webpage by calculating how much content shifts around the page as it loads (such as pop-ups and cookie banners). The more movement users experience, the more it can be disruptive and frustrating. Reducing CLS helps provide a smoother and more predictable user experience.

Performance metrics in Lighthouse
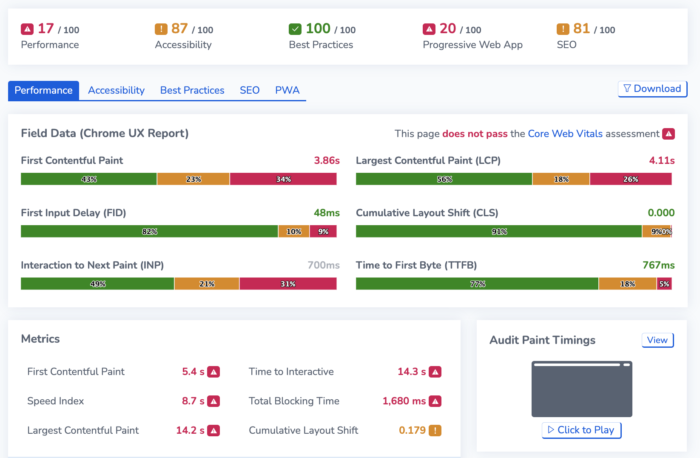
On the performance tab of your Google Lighthouse test, you can see two sets of metrics: Field data and metrics.
Field data (Chrome User Experience Report) is a public dataset offered by Google that contains real-world performance from users of the Google Chrome web browser. This data is collected and aggregated from users who have opted in to share usage statistics. If your site experiences enough traffic from Chrome users, you will be able to see this data at the top of the Performance tab.
Metrics are the timings from the latest test run and are measured under the test conditions (the region, device and throttling) specified when the monitor was set up.
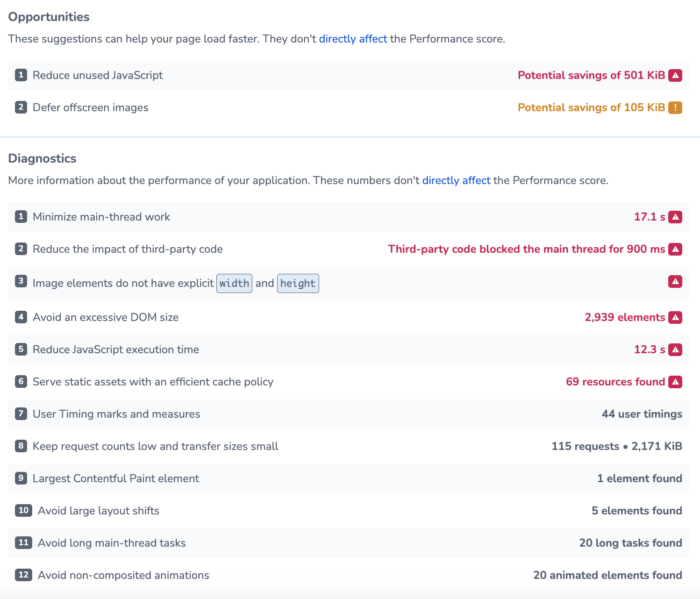
You can also see opportunities and diagnostics for improving performance. This highlights suggestions to improve the performance of your website, such as reducing unused CSS and JavaScript. You should read through these to identify any improvements for your site.

Opportunities and Diagnostics
Read more