Analysing data from your Google Lighthouse monitor
A Google Lighthouse Monitor allows you to schedule a regular audit of your site; Google Lighthouse is an open-source tool to test the quality of web pages; this is divided into 5 scored categories:
- Performance
- Accessibility
- Best Practices
- SEO
- Progressive Web App (PWA)
RapidSpike uses live test environments to simulate the Google lighthouse score for real users in locations around the world, on both mobile and desktop. You can read more on setting up a Google Lighthouse monitor here:
Where to find in RapidSpike
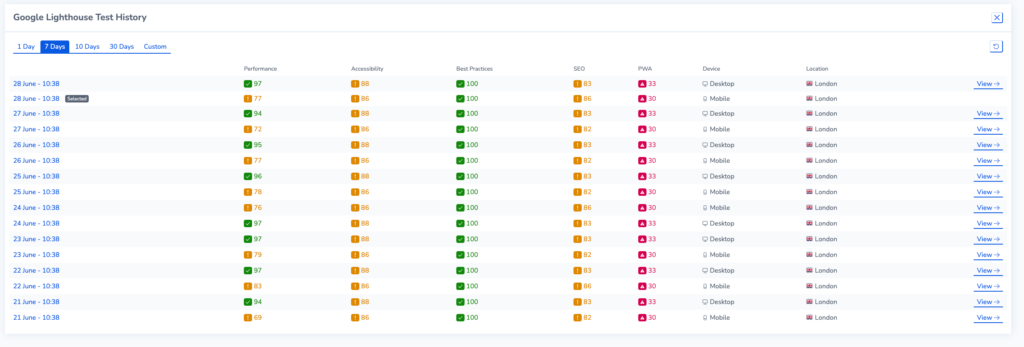
To access your Google Lighthouse monitor, go to Websites > Page and select the page you want to analyse. Navigate to the Google Lighthouse tab to see the scores for the latest test result.

View Mobile and Desktop Data
Go to Test History to show a list of past tests. Click View next to the appropriate test data.

Performance
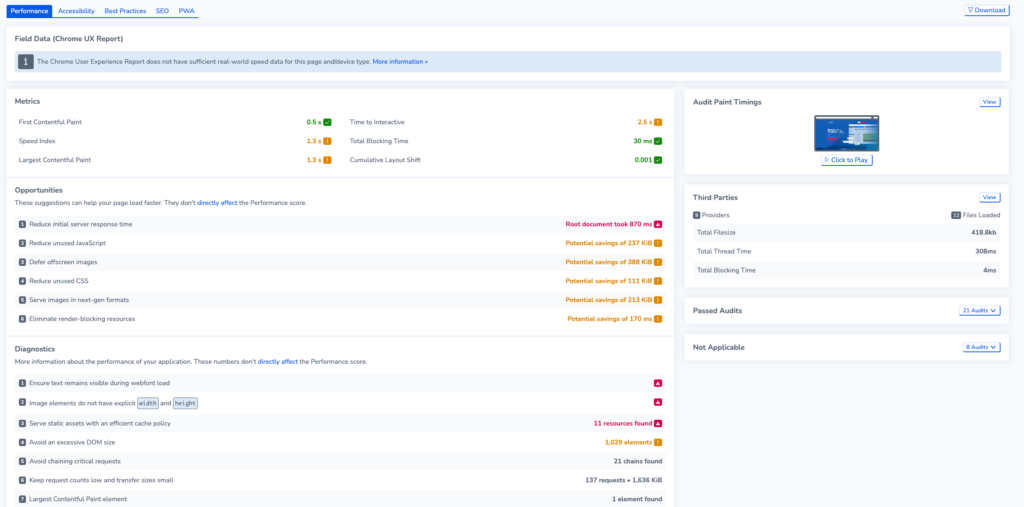
View your Performance Audit results on the performance tab. Lighthouse uses six metrics to calculate this score, based on load time and user experience. This includes LCP and CLS – Google’s Core Web Vitals.
Metrics
First Contentful Paint (FCP): The time taken for the browser to render the first piece of content on a webpage. It indicates when users start seeing visual changes on the screen.
Time to Interactive (TTI): TTI measures how long it takes for a webpage to become fully interactive and responsive to user input. It represents the point at which users can actively engage with the page.
Speed Index: How quickly the content of a webpage is visually displayed. It provides a score that represents the perceived load time based on how quickly visible content appears.
Total Blocking Time (TBT): Time when main thread of a webpage is blocked and unresponsive to user input. It reflects the time period when a user might experience delays or unresponsiveness. This is used instead of the Core Web Vital First Input Delay (FID) for Google’s synthetic testing.
Largest Contentful Paint (LCP): Time for the largest piece of content (e.g. an image or a video) to be rendered and displayed within the viewport. It helps assess the loading performance of the most significant content. This is one of Google’s Core Web Vitals.
Cumulative Layout Shift (CLS): CLS measures the visual stability of a webpage by calculating the sum of all unexpected layout shifts that occur during the page’s lifecycle. It describes the amount of content movement that users experience, which can be disruptive and frustrating. This is one of the Core Web Vitals.
Opportunities and Diagnostics
As well as metrics, Lighthouse’s performance audit provides optimisation tips to improve the load time of your page in the form of opportunities and diagnostics. All of this is available to see in one place in your Google Lighthouse test results:
Additionally, the Chrome UX Report (CrUX) is a collection of data on user experience metrics. The data is collected from real chrome users around the world and assesses the overall performance and user-friendliness of websites. The report is created and updated by Google.
You can view Passed or Not Applicable audits to the right of the test results.

Accessibility
On the Accessibility tab, you can view the test results for your page’s accessibility audit. Google Lighthouse scores accessibility based on a series of pass/fail criteria. Each criterion is weighted according to severity. They are divided into three main sections.
- Contrast: Relating to the legibility of content.
- Navigation: ways to improve keyboard navigation on your webpage.
- Names and labels: This relates to semantics and ways to make your site easier to read by assistive technologies such as screen readers.
The report includes a list of items to manually check on your webpage: these do not count as part of your score as automated tests by Google Lighthouse cannot cover them; however, they can be important for allowing all users to access your site.
There is a list of Passed or Not Applicable audits on the bottom right.

Best Practices
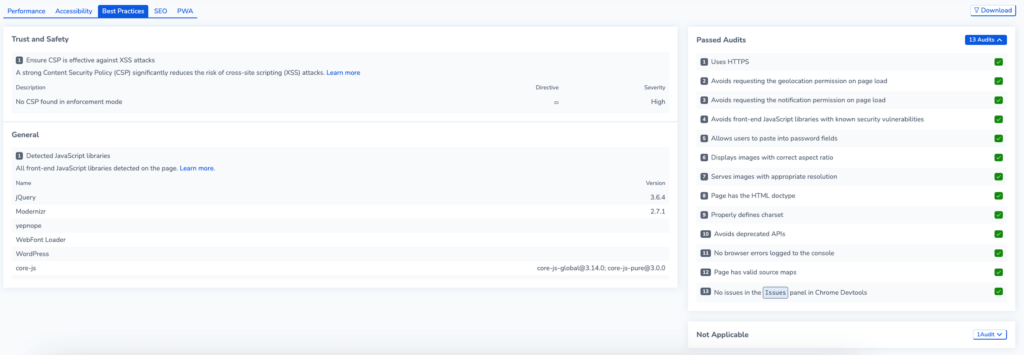
Lighthouse’s Best Practices audit highlights the quality of the code in your web app.

SEO
On the SEO tab, you can view the SEO audits from the latest test. This includes aspects of your webpafe that can enable web crawlers to read the content more effectively.
- View a list of resources on your site that can be changed for better SEO practice.
- View Items to Manually check that lighthouse cannot test for.
- See a list of passed audits on your web page.

Progressive Web Apps (PWA)
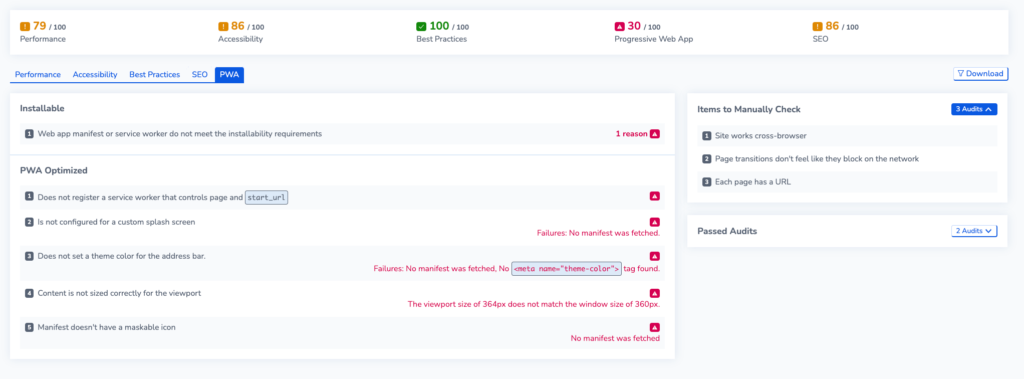
Lighthouse also has checks for Progressive Web Apps. These web apps are designed to act and feel like platform-specific apps (for example, adding a site to your mobile’s home screen). In the PWA tab, you can view a series of audits on whether your site is a PWA.
- View the Installability of your page. You can view more about installability here.
- Ways to make your page more PWA Optimised.
- Items to manually check.
- You can also see the list of passed audits on the right.

Download your report
Select download for a copy of your lighthouse test results as an HTML Report or Raw JSON file.
Learn More About Google Lighthouse
You can read more about the different sections of the Google Lighthouse report and how Google calculates each score on their official documentation.