Waterfall
Waterfall
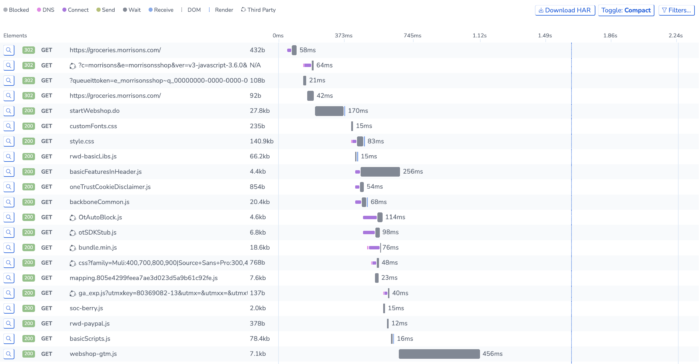
The waterfall tab displays something called a network waterfall chart. This is a list of network requests that are made on your site in chronological order. Essentially, it is a timeline of your page loading from start to finish showing all the resources that are loaded during this time.

A network waterfall chart in RapidSpike.
When you load your website, the browser will read the HTML and then load any resources that are included. This includes CSS and JavaScript files. You can use the chart to see how long each resource takes to load, and if it is blocking any other elements later on from loading.
The waterfall chart also identifies third parties. These are resources that are loaded from external sites such as marketing tools and content management systems. These are identified with a small icon.

The Third Party Icon.
Often Third Parties can cause issues with loading content onto your site. Viewing them in the waterfall is a method to see the impact they are having.

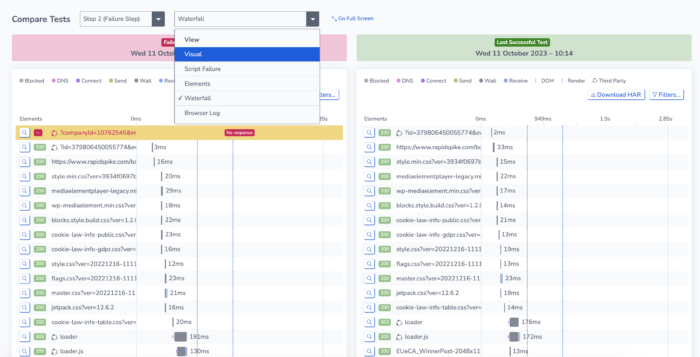
On the failure analysis tab, you can select the waterfall tab to compare network requests between both pages. Notice how the failed test seems to have an issue with a third-party element!
Read more
Analyse data from Page Load Monitors
Analyse Data from User Journeys