Uptime Investigation
Uptime Investigation
In this lesson, we will go through how to find the investigation page. RapidSpike’s monitors allow you to investigate failures in great depth.
Understanding networking and how websites stay online can be quite technically complex. If you are new to the topic, you don’t need to worry about learning everything in this lesson. Instead, knowing how to access this information can be useful if you ever have to forward this information to your technology department.
Uptime Analysis
Begin by navigating to your Uptime monitor results within the RapidSpike platform. Identify the specific uptime test that has failed and click on the “Investigate” option associated with the failed test.

Click Investigate to see the analysis page.
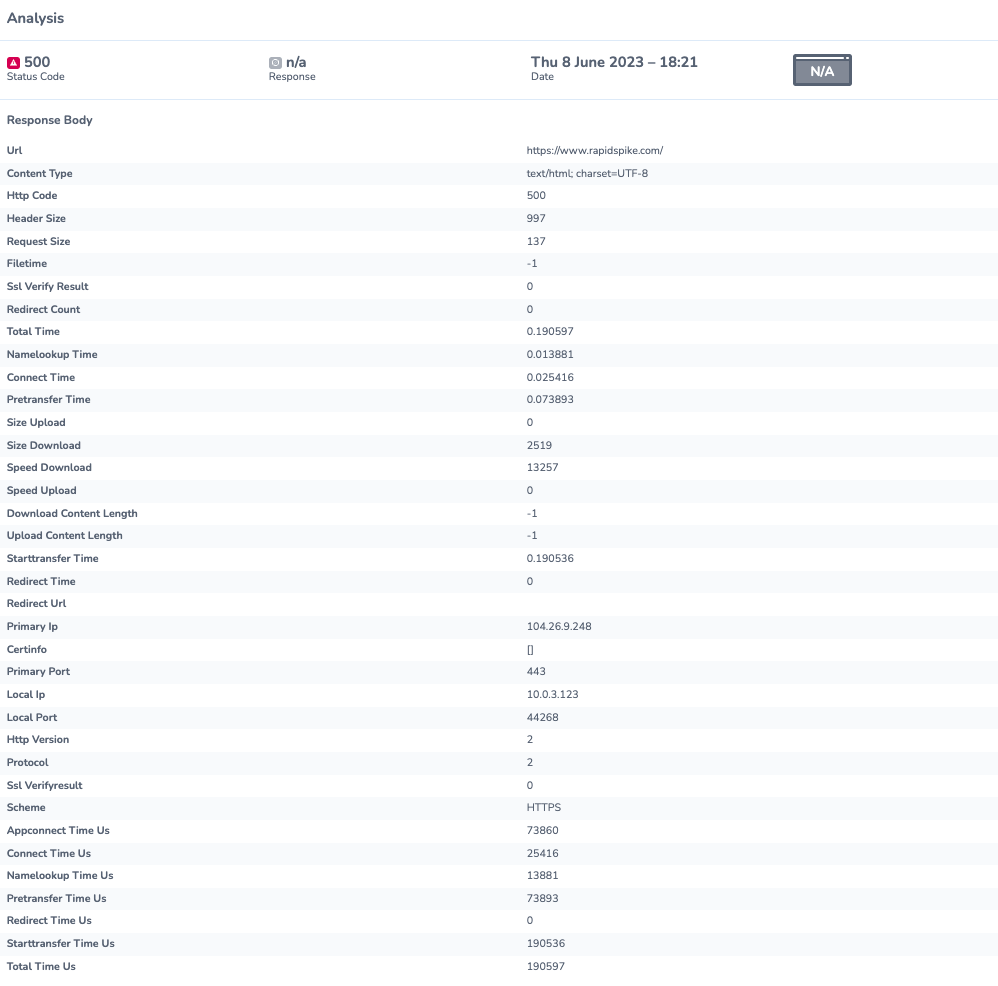
Clicking “Investigate” opens the Analysis Page, which is your gateway to understanding the failure in detail. Key data points available on this page include:
- HTTP Status Code: This code provides information about the server’s response to the request.
- Response Data: Details of the response received, which can be valuable for pinpointing issues.
- Date and Time: Timestamps help you correlate failures with specific events or changes.
- Screenshot: If available, a screenshot of the page at the time of the failure can offer visual context.
- Response Body: Examine the response body to understand the content returned by the server during the uptime check.

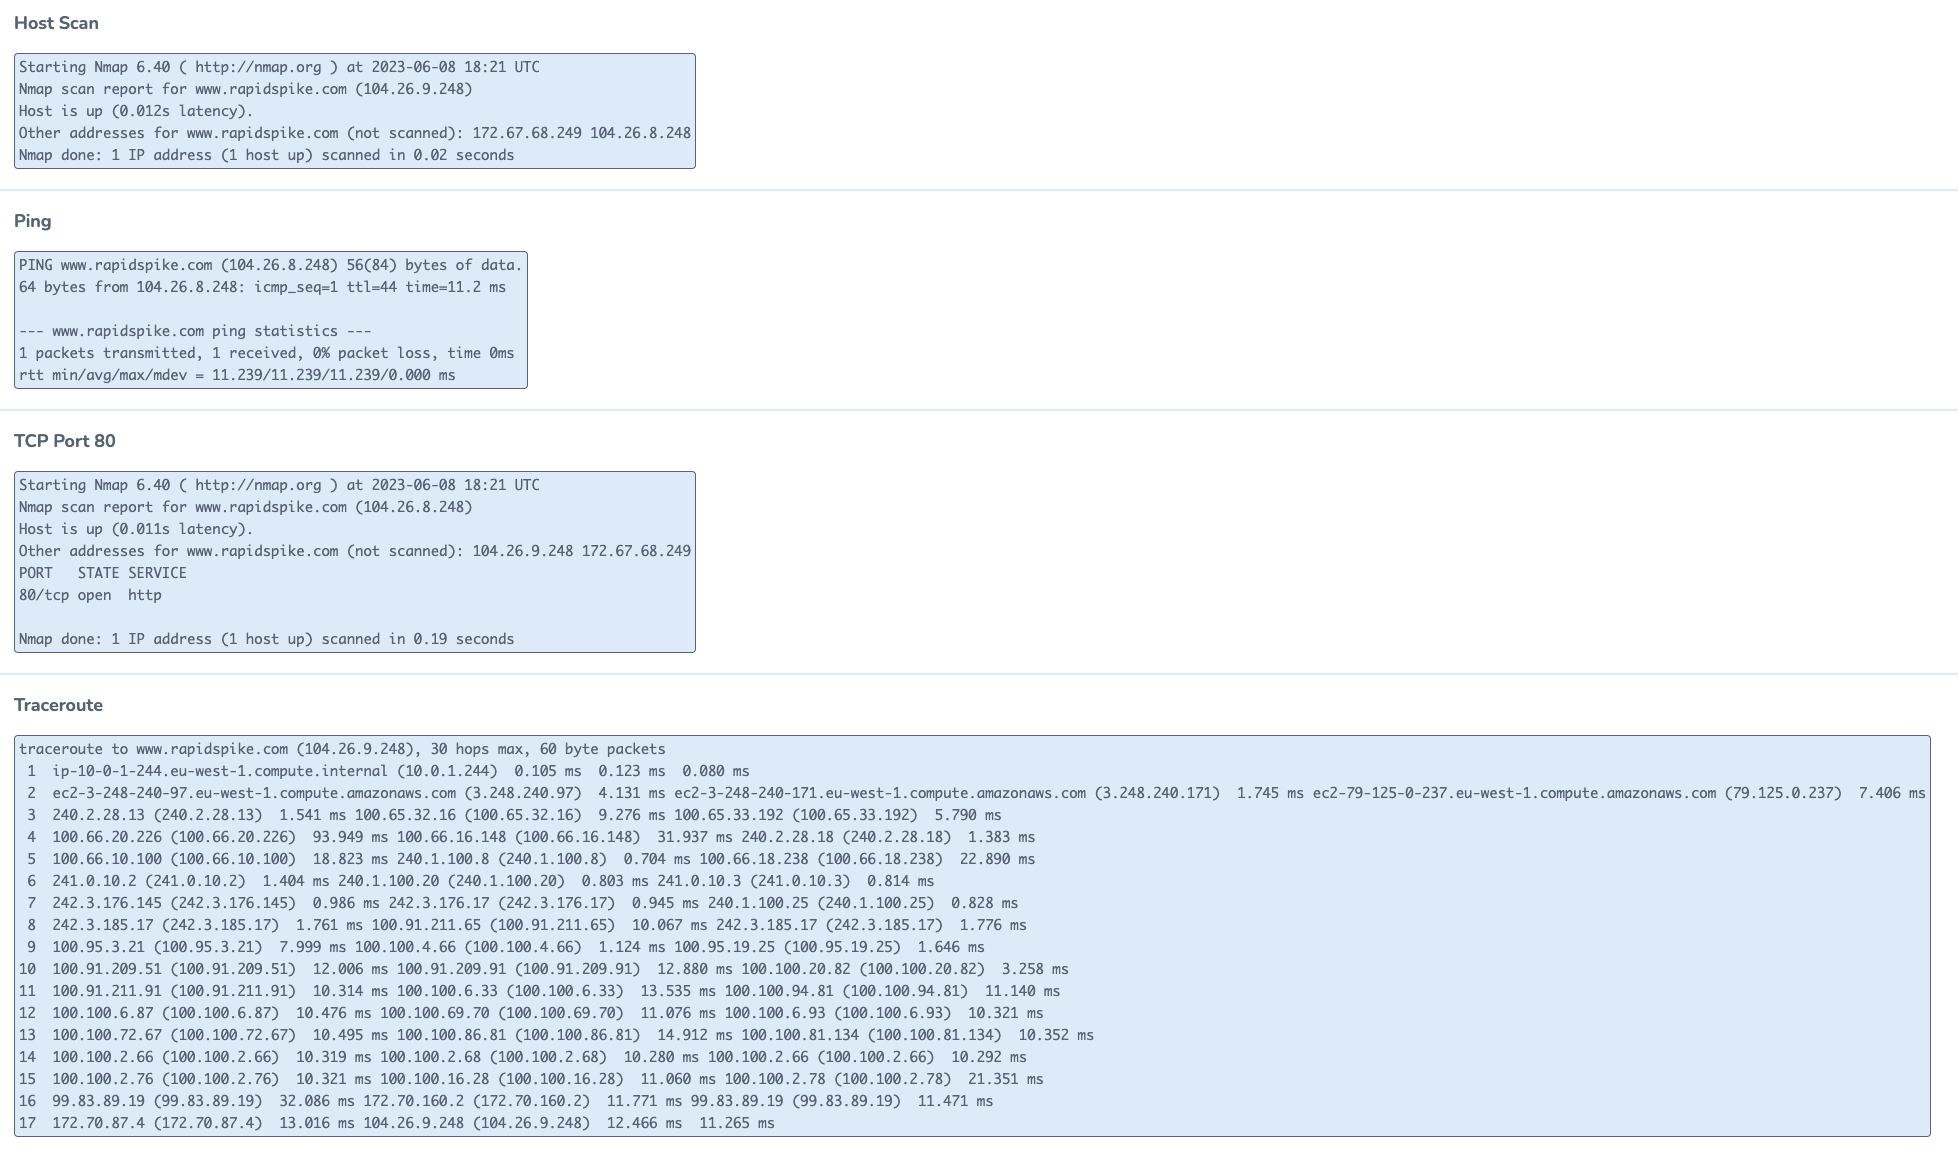
Further down the page are several tools for advanced investigation:
- Host Scan: A host scan can reveal information about the server’s current state, helping identify potential issues.
- Ping: Ping tests measure the round-trip time for data to travel between your monitoring system and the target server. Variations in ping times may indicate network problems.
- TCP Port 80: Checking port 80 ensures that the web server is responding on the expected port. A failure here could indicate web server issues.
- Traceroute: Traceroute is a network troubleshooting tool that traces the path data takes from one device to another on the internet. It can help identify network bottlenecks or routing problems.

Further Reading