Analysing data from Uptime Monitors
Introduction
Uptime Monitoring provides valuable insights into the availability of your website. Within the RapidSpike app you have access to a wealth of data on your website’s uptime. To get started, you can add a new monitor or edit an existing monitor.
View Uptime Test Results in RapidSpike
Go to Websites > Pages and select a page, then go to Uptime. This will bring up the latest test result data.
Overview
At the top of the page, you can see key data about your website’s uptime.
- Status
- Total Downtime
- Uptime Percentage
- Latest Region
- Latest Test time
If the status is Failing it indicates that your site is currently flagged as down or experiencing issues. Common reasons for a failing status include:
- Your site is down.
- Your site is returning a different status code than expected.
- Our monitoring system is being blocked by your website.

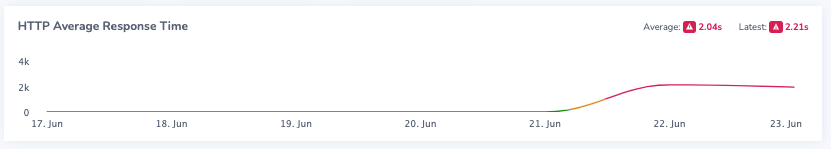
Response Graph
The response graph visually represents your website’s uptime over the selected time period. Hovering over the dots at different intervals allows you to view the corresponding response times. This feature is particularly useful for quickly identifying spikes or intermittent issues without having to review each individual test separately.
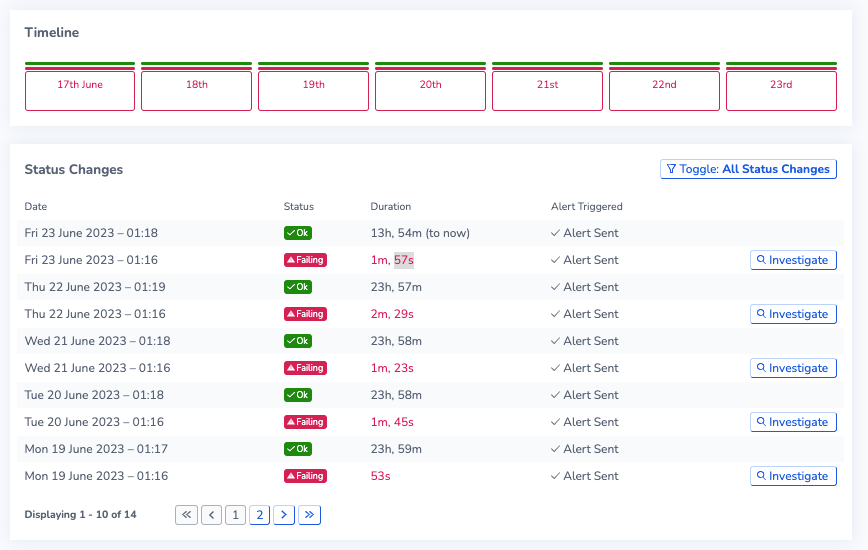
Timeline / Status Changes
The Timeline and Status Changes sections are specifically designed to track downtime occurrences. These sections provide detailed information about when downtime events took place, how long they persisted, and when the website became accessible again.
You can perform a root cause analysis by pressing investigate.
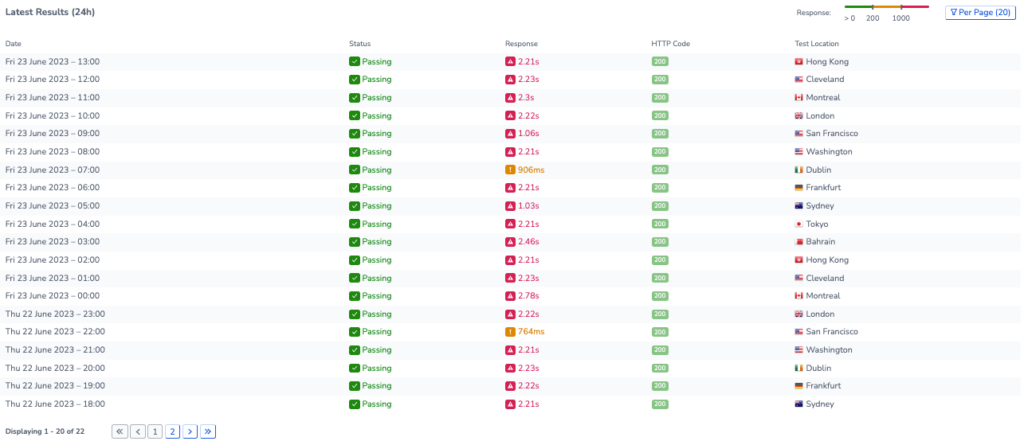
Latest Results
The latest results section displays the most recent test results automatically. By increasing the data range, you can go further back in time to compare additional data.
This panel also provides information about the location of each test. If there is an issue with a particular location, you will be notified here.