Investigate Uptime Failures
Uptime is a critical aspect of any online service or website. You can investigate an uptime failure using the analysis page, this provides root cause analysis as part of RapidSpike’s Uptime Monitoring data.
How to use Uptime Analysis
- Go to your Uptime monitor results.
- Click Investigate on the failed test.
- This will open up the Analysis Page. You can see various data including the HTTP status code, response, date and time, and a screenshot of your page if available.
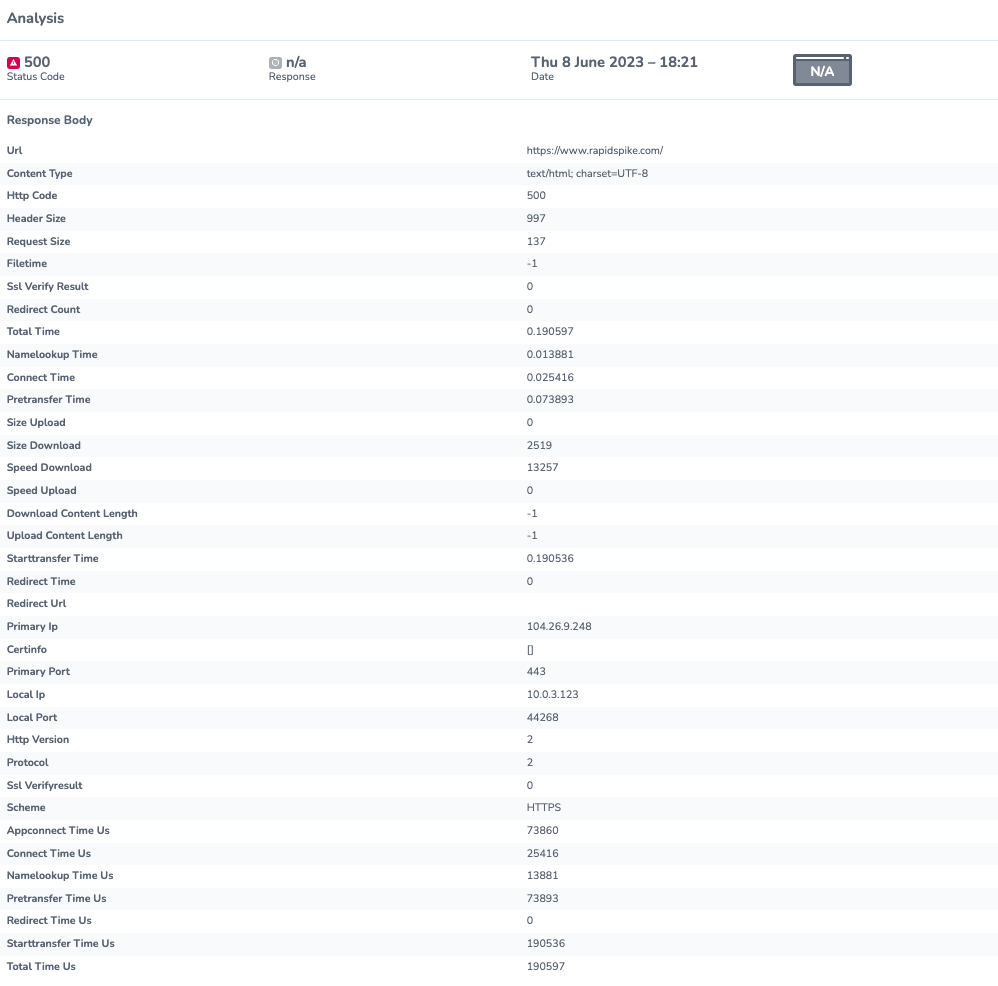
On the analysis page, you can look into the uptime failure in detail:
- Response Body
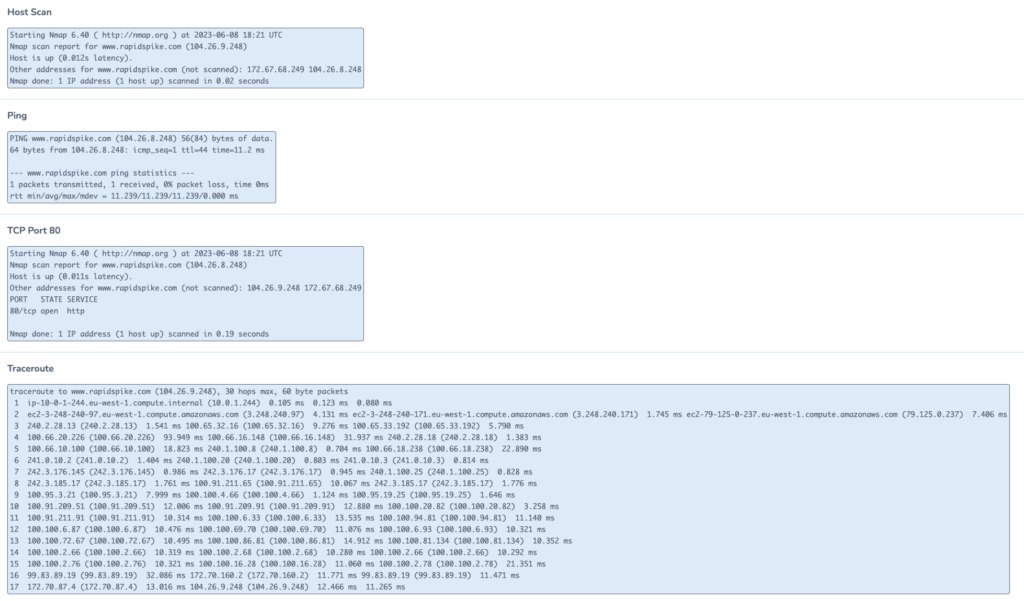
- Host Scan
- Ping
- TCP Port 80
- Traceroute: Traceroute is a network troubleshooting tool that traces the path and measures the time it takes for data to travel from one device to another on the internet. You can find out more about Traceroute here.
By using this data, you can establish any networking issues that might be causing downtime.