Limitations of Uptime Monitors for Website Monitoring
Limitations of Uptime Monitors for Website Monitoring
Uptime checks are just the tip of the iceberg when it comes to website monitoring. Having a website or web application that is merely “up” is not sufficient to guarantee a great user experience.
The Limitations of Uptime Checks
- Uptime checks don’t assess the functionality or performance of your website.
- They won’t detect issues with slow page load times, broken links, or missing content.
- Users may experience problems even if the site is “up.”
Just because the site is live for users, you will not be able to establish if the site is working correctly. Uptime Monitors are some of the most basic checks you can make on the site; they measure a server response (including website uptime monitors) and do not render your website in a real browser.
There could be a myriad of problems that are missed by relying only on an Uptime monitor. Therefore, it is important to include other monitors that render your page in a browser (like your users will).
Other Monitoring
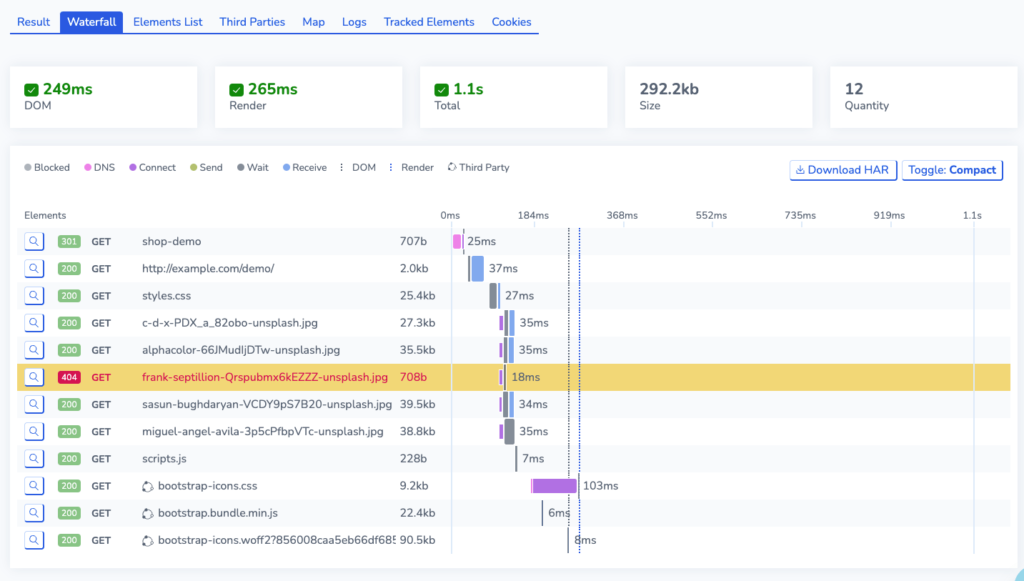
Page Load – The Page Load Monitor loads your website in a real browser. It tracks and analyses how quickly a web page loads and measures various performance metrics associated with web page loading. This provides a much more detailed check into whether your site is loading well for users.

A waterfall chart from a Page Load Test. Unlike with Uptime, you can see how elements on your page are loading (or not loading). You can see one element is having an issue!
Analyse data from Page Load Monitors
User Journeys – User Journeys are even more detailed than Page Load Monitors and record a complete transaction in a browser. You can script a process that customers might perform (e.g. buying a product). If something on your site is not working then you can identify this with a User Journey. For example, a button to add an item to the cart might be broken, stopping customers from being able to buy things on your website. Your website is live, but customers can’t use it!

A User Journey showing a broken delivery page.
Synthetic User Journeys: Technical Guide
Performance Monitors
You can use Web Vitals Monitors and Google Lighthouse Monitors to check on key metrics that affect user experience – such as Core Web Vitals.
Core Web Vitals and Performance
Analysing data from your Google Lighthouse monitor
By utilising many different monitors, you can gain a more comprehensive overview of your site’s functionality beyond its uptime.