Analyse data from Web Vitals
RapidSpike’s Web Vitals monitor periodically checks the performance of your webpage. Web Vitals are metrics used to measure the user experience of a website in terms of speed, responsiveness, and visual stability. To get started with Web Vitals, you can add a new monitor or edit an existing monitor for a page on your website.
View Core Web Vitals Test Results in RapidSpike
Go to Websites > Pages, select the page you want to check, and then select Core Web Vitals. This will bring up the latest test result for your Web Vitals Monitor. You can click Test History to view historical test result data for the previous 30 days.
Headlines
Go to the Headlines tab for an overview of your Web Vitals results. On this tab, you can view the Web Vitals for your page and compare them across time.
- Select the Time Period in the top right corner to view historical data between 1 day and 30 days.
- View the Timeline and Distribution of your recent test results. The distribution graph will show you how many of each score occurred for the tests in that time period.
- Hover over the graphs to view the date and time of each test.
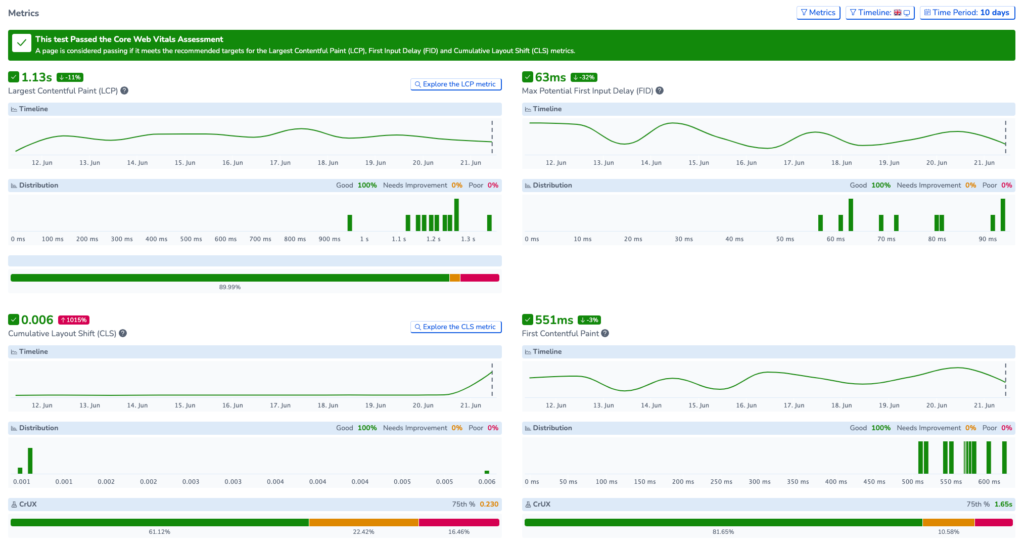
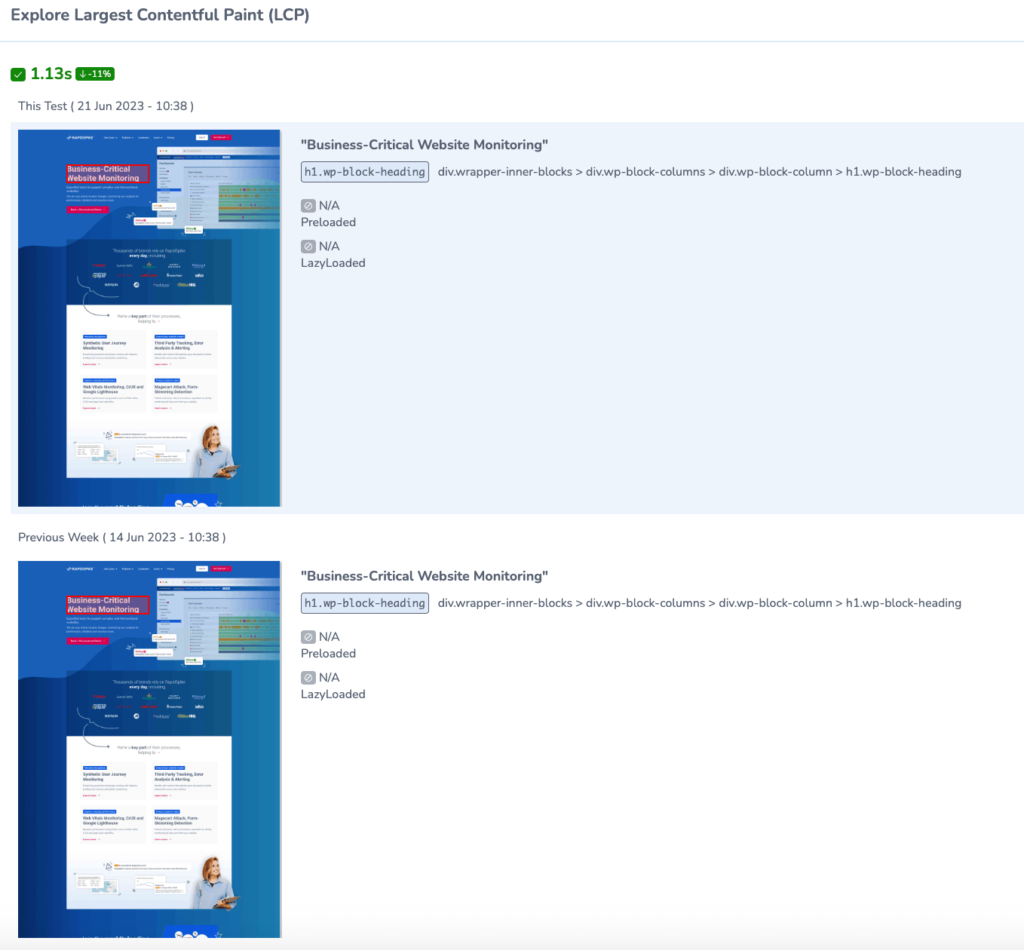
You can Explore the Largest Contentful Paint and the Cumulative Layout shift of your pages. Select Explore the LCP metric to view information about the largest elements on your page. Go to Explore the CLS metric to find out more information about unstable elements on the page.
View the filmstrip to visualise how your page is loading for users; you can scroll across to view the state of your page at each stage of loading. Each web vital is marked on the filmstrip so you can see a timeline of exactly what has loaded at each point.
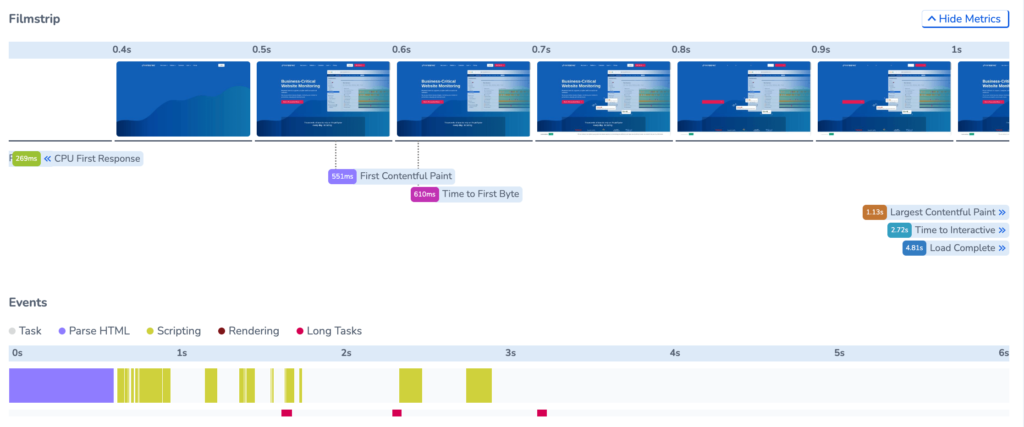
There is also a chart for events to view a record of different tasks while loading the page. This includes the time spent parsing the HTML, scripting, rendering and long tasks.
Network & Server
By navigating to the Network & Server tab, you can view the page waterfall and visualise the timings for all elements loading on the page. Each element is labelled with its size and level of priority and colour coded by type.
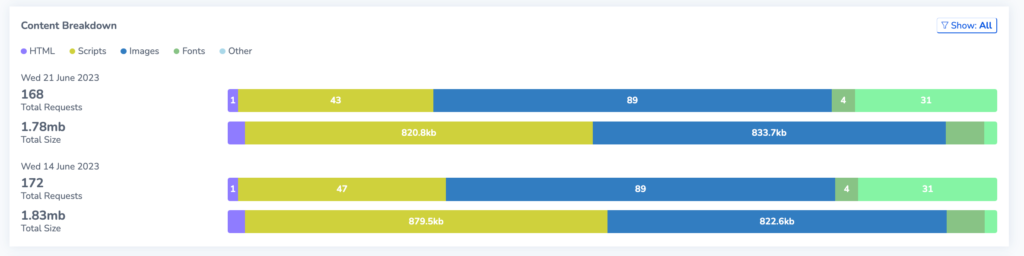
Below is the Content Breakdown for the page. Here you can identify which types of elements are most common and which ones are largest in terms of size.
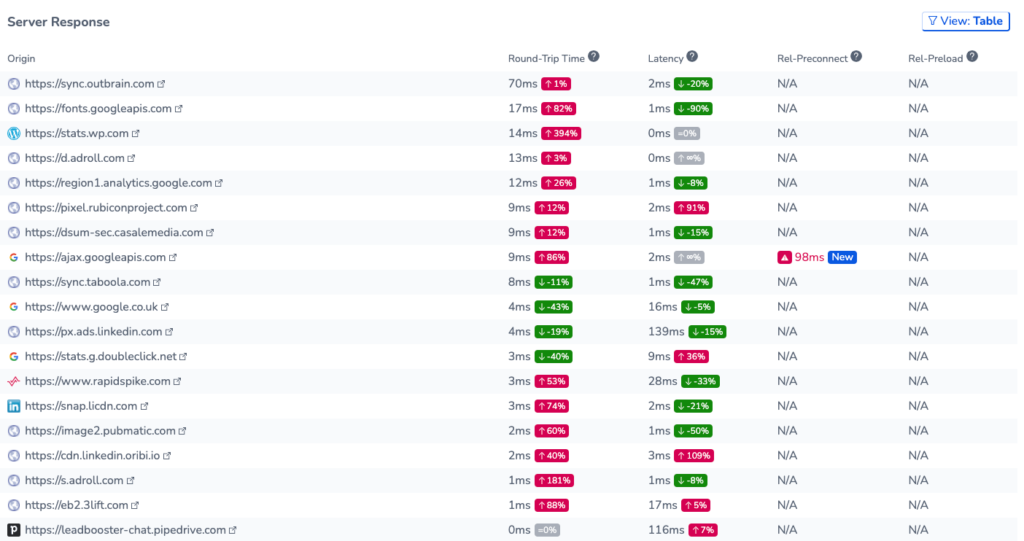
In the Server Response section, you will find the following information:
Origin Data: The URLs where content is loading from.
Round-Trip Time: This indicates the time it takes for a request to travel from the origin to the server and back. If this is high, then servers closer to the user could improve page performance.
Latency: This describes the delay between sending a request and receiving a response. If Latency is high this could mean the server is overloaded or has poor backend performance.
Rel-Preconnect/Rel-Preload Usage: Rel-Preconnect and Rel-Preload techniques are relationship ‘rel’ attributes for <Link> elements. These can be used to prioritise specific resources during page load. You can identify if these attributes have been used for resources on your site, and the impact on page performance.
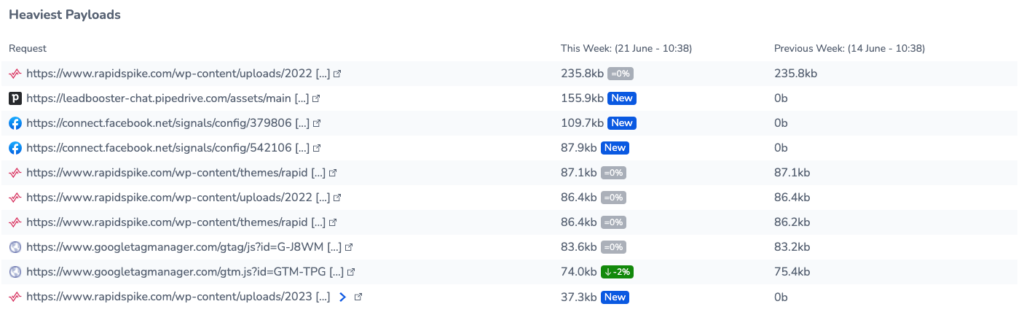
On this tab, you can also view the Heaviest Payloads on the page to see which of the elements in the network requests are the largest and might have the greatest impact on performance.
JavaScript & CSS
On the JavaScript & CSS tab, you can:
- View the main thread breakdown while rendering and processing the JavaScript and CSS, and the total time that is taken for Script Evaluation, Style & Layout, Script Parsing, HTML & CSS, Rendering and Garbage Collection
- View the total JavaScript Execution Time
- View a list of all JavaScript & CSS on the page with the blocking and total Load time, as well as check for Legacy JS and Unminified/Unused scripts.
Images
On the Images tab, you can view the Render Timings for all the images on your webpage.
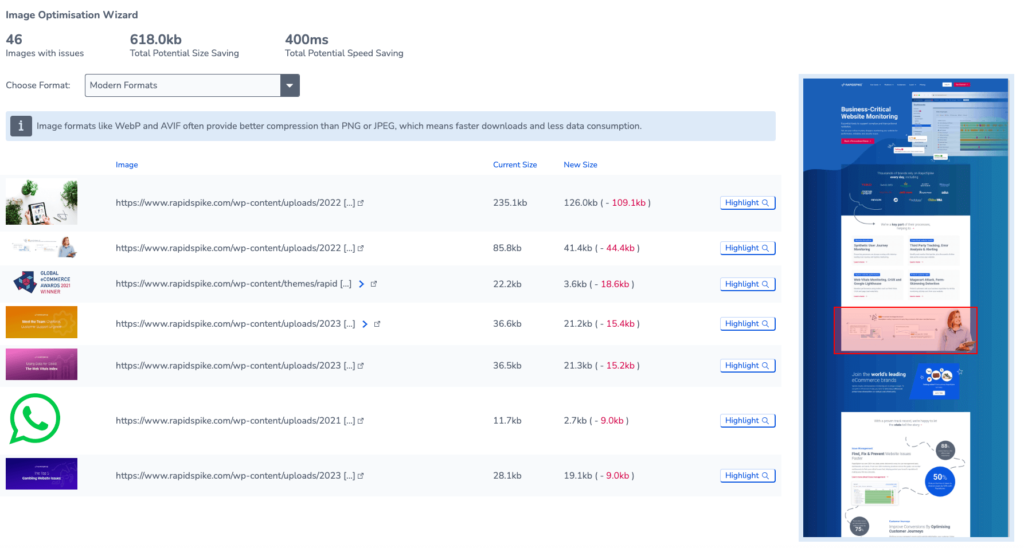
This section contains the Image Optimisation Wizard. This is a powerful tool to break down the images on your site and analyse how they are affecting your core web vitals. You can filter all images with issues on your webpage:
Modern formats: Identify images that can be converted to modern formats like WebP and AVIF, allowing you to considerably enhance download speeds and decrease data usage.
Offscreen Images: Find offscreen and hidden images on your page; by lazy-loading these images you can defer the loading of these images until after essential resources have been loaded and reduce the Time to Interactive (TTI) for your page.
Un-sized Images: Filter out unsized images on your webpage. By assigning specific dimensions to these images, you can prevent content shifting on the page, helping to reduce Cumulative layout shift (CLS).
Un-optimised Images: Isolate images that can be optimised to load faster and consume less cellular data.
Select Highlight to visualise the location of the image on your webpage.
Compare
Here you can compare different test results for both pages and individual tests. You can compare the Web Vitals data from pages on the same site, or on other pages from other sites you are monitoring. This includes metrics, content breakdowns and filmstrips for your tests.
You can compare up to a maximum of 4 tests at one time.